Gantt Chart – How to plan and track a project development
The Gantt Chart is the most widely method used in business planning of activities on all kinds of projects, besides it can also be used to plan any type of activity over time.
The method consists in a horizontal time shaft, and under it you have to put the activities that you want to track. A project is a group of linked activities, so you have to separate each activity and organize them under the time shaft. Each activity is linked with the others and you can select different kinds of links to mark this (for example, the link “end-start” means that when the activity N is finished, then automatically starts the activity N +1). Thus, using this methodology you can find the project’s critical path, which determines the minimum time to complete the whole project. Additionally, you can add to each activity its number of resources needed (workers ) to control costs and the workload of the involved people.
Also, during the development of the project, if you add the progress of each activity (0% = not started yet, 100% = already finished), you will be able to calculate the delays and the cost of your project, and reschedule the activities to end as soon as possible.
The Gantt Chart methodology is usually applied using software applications. The most used is Microsoft Project, but you also have many others programs, as Gantt Project (http://www.ganttproject.biz/) which is free and it works on Windows, Linux and Mac. Gantt Project also include a portable version which does not need installation (very useful if you’re on a company and your computer doesn’t have administrator access).
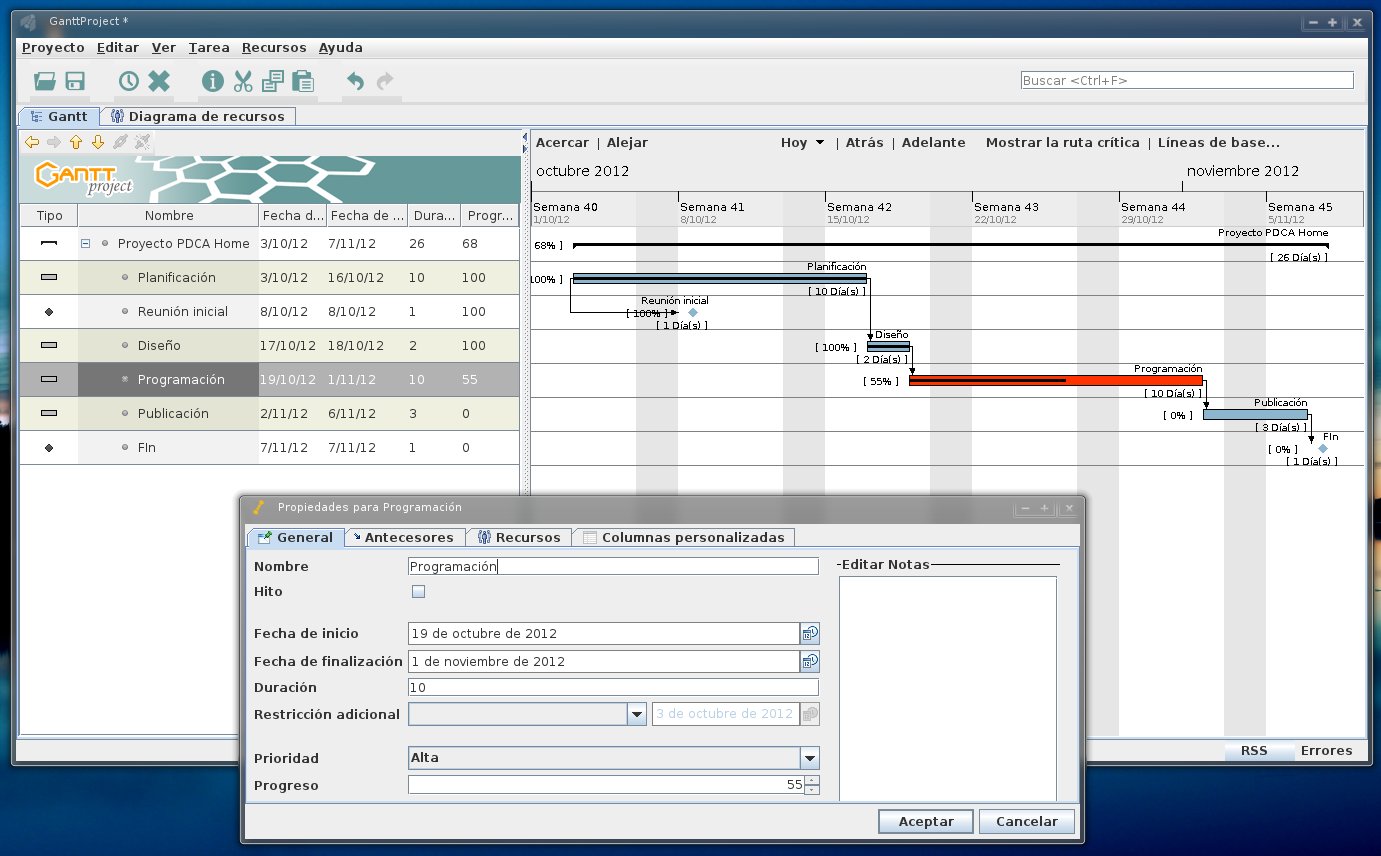
Below this, you have an example: A “website designing and development ” project, where they have established different tasks, with its duration, dates of meetings. Once introduced the inputs, the software has calculated the exact dates of each activity and the finish date, taking into account the holidays and the relations between the different tasks:
Here you have an example of the relations between activities and the tracking of a a project using a Gantt Chart:
Original post (in spanish): http://www.pdcahome.com/diagrama-de-gantt/