Methods for measuring customer satisfaction
For Everyone knows that the customer is at the heart of the organization, product or service we provide revolves around him and the satisfaction that has this of our business, there are many indicators that help us measure the perceived quality of products and services with these customers, the happy customer satisfaction indicators. These indicators are generated through telephone surveys, by post and other means to provide this information. But is it really a reliable indicator? Are there factors that distort the final result and make us make a wrong strategy?, I mean the correct interpretation or not made about this data. The aim of this article is to know some of the indicators that make the company take a series of decisions based on these results to focus resources toward continuous improvement.
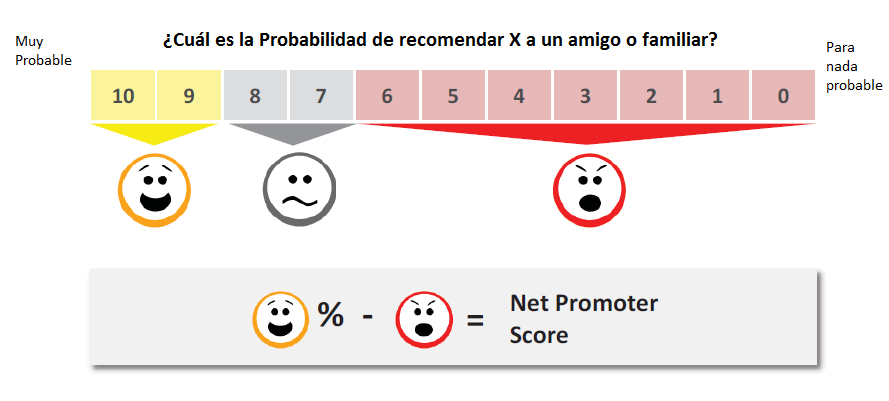
The first indicator with which work will be the NPS, Net Promoter Score, is an easily obtainable and measurable indicator that is extracted through only question where the customer passes rated Promoter (P), Neutral ( N) or Detractor (N) depending on the score you have given to the question asked of 10-9 Promoter, Neutral 8-7 and 6-0 Detractor (although it depends on the requirement of service the company in question) . Once calculated is simple to interpret and mark a benchmark against the competition and work on sectoral studies.
However, contrary to the simplicity of this indicator have been studies that provide evidence that is not the best predictor of customer loyalty.
What makes this indicator loses strength analysis?
1. We begin with that for this metric information is lost, that is, work with 3 groups (PND), we can not make a separate calculation and increases the statistical error. To give you an idea, in a survey do not get the grade of each client (0-10) but we will talk about a perceived quality of excellent service to poor there is a difference of 10%, we lose Customization by each customer. We had a continuous variable 11 groups (0a 10) to a discrete variable (3 groups).
2. We have more than one interpretation with respect to the same result, going into detail, we can get the same NPS for two very different situations, this means very different performance requirements.
3. This metric is very sensitive to small changes, since the changes that occur in scores between groups involved in obtaining a very different NPS facing a similar assessment.
4. Difficulty to mark a cutoff between groups. Since every company is going to perform according to their needs.
We can determine that the NPS is a purely intuitive metric that gives us an idea of where our company moves, and a relative position of how we find ourselves at another point in time or over the competition. To create a more stable indicator is necessary to be clear that numbers work.
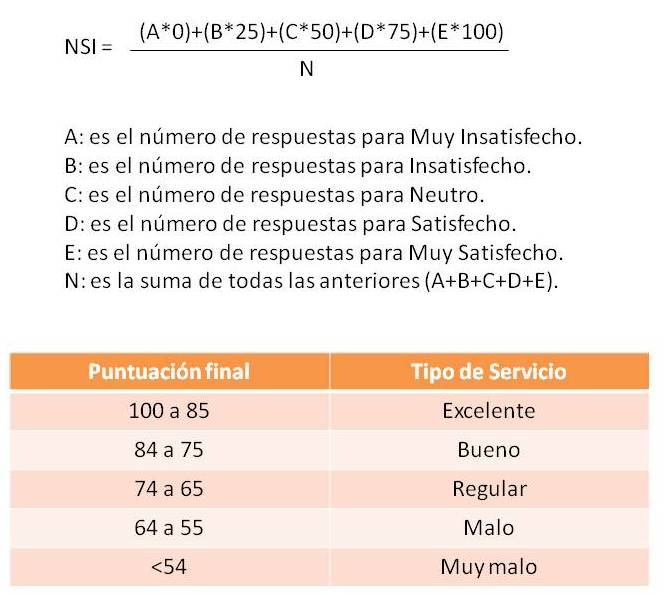
The second of the indicators work is the NSI (Net Satisfaction Index), again we return to measure customer satisfaction based on the number of responses against a qualitative survey and quality of those votes. This time the service Very Satisfactory Unsatisfactory Very valued. Depending on the volume that has been obtained in the different groups perceived quality of service.
As shown in this formula are weighted with greater value responses higher semantic evaluation. Even the group’s responses of “Dissatisfied” are weighted 25% and it is assumed that the client has “some” small satisfaction that is. Positioning values NSI allow us to know our level of quality as far as customer satisfaction is concerned are set out in the following table.
The standard of excellence EFQM also shows the measurement of quality in its parent REDER in this case refers to Nª6 section of this standard called result in customers. Unlike the previous indicators EFQM makes a note of satisfaction in terms of the definition we make ourselves what we mean by customer, within this major criterion is divided into two sub-criteria: 6a refers to the perception of the service received, that is, on his view of how we have done our job. Ultimately measured customer satisfaction, users or beneficiaries of the organization. These measures can refer to aspects such as technical skills, behavior, accessibility, communication, responsiveness, courtesy, empathy, added value, innovation, handling complaints and claims, loyalty …
And the sub-criterion 6b Try on internal measures to analyze the performance of activities with customers, users or beneficiaries, ie on the amount of things we do. These measures can refer to aspects such as: number of interventions, complaints and claims rate, number of service demands, error rates or incidents, response time, types of services offered, attended segmentation of collective …
Likewise, the ISO 9001 in its Point 8.2.1 talks about customer satisfaction, but never tells you how to measure, like EFQM is limited to the measurement of customer satisfaction is a mandatory requirement to pass certification and always seek areas for improvement to increase this satisfaction.
I will be adding new ways to measure customer satisfaction, do not miss it.


